VPP
Motivation
Multimodal reasoning has recently extended the paradigm of Chain-of-Thought (CoT) prompting from text to pixels in large vision–language models (LVLMs). Despite strong performance, these models often produce fluent but unverifiable rationales—outputs that appear coherent yet lack grounded visual logic. In such cases, models arrive at correct answers through flawed intermediate steps, achieving global accuracy without local logical fidelity.
We characterize this failure mode as cohesive dissonance: a disconnect between surface-level coherence and step-wise visual reasoning correctness.
RealCQA-V2: Visual Premise Proving
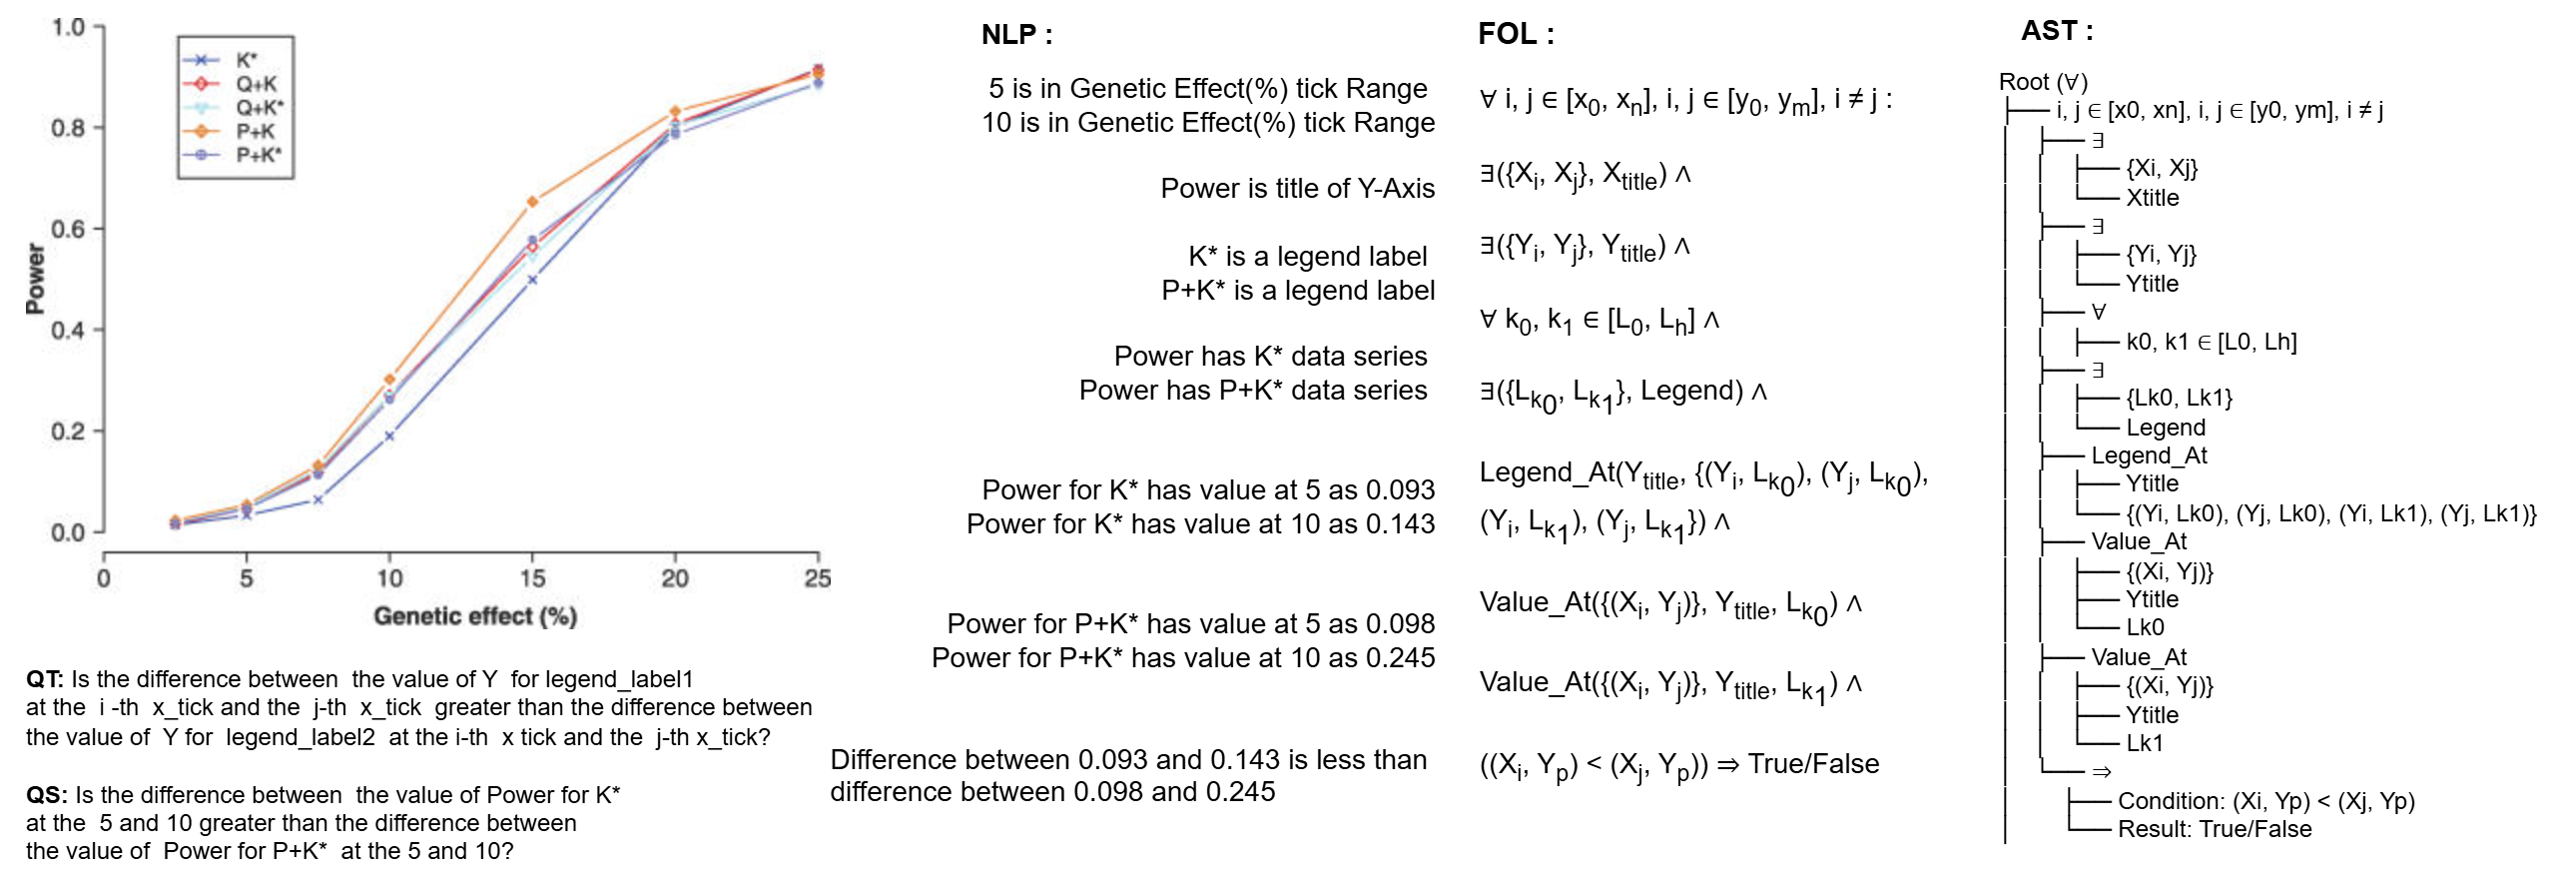
To systematically study this phenomenon, we introduce RealCQA-V2, a large-scale benchmark that reformulates multimodal reasoning as Visual Premise Proving (VPP).
In VPP, each visual question is decomposed into atomic, verifiable premises—structured visual statements grounded in real scientific charts. These premises compose explicit reasoning chains, enabling fine-grained evaluation of both local and global reasoning behavior.
Evaluation Protocol
We evaluate leading black-box and open-source LVLMs (including GPT-4o, Gemini 2.5, and InternVL-2/3) in the zero-shot setting under two prompting regimes:
- Singleton prompting (local reasoning)
- Chain-of-Thought prompting (contextual reasoning)
We introduce two complementary metrics:
- AccVPP — measures full-chain validity
- DCP (Depth of Correct Premises) — measures partial reasoning depth
In addition, we report results from LoRA fine-tuning over the training premises.
Key Findings
Our experiments uncover a hidden trade-off between localized and generalized reasoning:
- Large “thinking” models demonstrate strong holistic coherence but exhibit brittle chain failures
- Smaller, vision-centric models retain local grounding fidelity yet struggle with global abstraction
Conclusion
RealCQA-V2 exposes a fundamental tension between orthogonal reasoning modes in existing LVLMs. By making intermediate visual premises explicit and verifiable, the benchmark enables transparent diagnosis of reasoning failures beyond final-answer accuracy.
We release the dataset, evaluation metrics, and code to support reproducible and verifiable progress in multimodal scientific reasoning.
Status: Active development
Primary repo: cse-ai-lab/VPP
📦 Dataset
- Download: TBD
- Format: JSONL with fields like
id,qa_id,qid,image,tag,truth,source,question,premises, etc. - Splits: train / val / test
Quick example (illustrative)
{
  "id": "example_0001",
  "qa_id": "pmc123__tagA",
  "qid": "qid_001",
  "image": "images/pmc123_fig2.png",
  "question": "Is the blue curve increasing after x=10?",
  "premises": [
    {"tag": "SP", "text": "The x-axis ranges from 0 to 20.", "truth": true},
    {"tag": "DP", "text": "After x=10 the blue curve slopes upward.", "truth": true}
  ]
}
Results: Premise-Level Accuracy
Table: Premise-level accuracy (%, rounded to two decimals) across models and prompting modes.
# denotes the total number of premises evaluated. Best accuracy per row is highlighted in bold.
| Prompt Mode | # Premises | GPT-4o | Gemini 2.5 | IVL2-8B | IVL2.5-8B | IVL2.5-FT-S | IVL2.5-FT-CoT | IVL3-8B | IVL3-9B | IVL3-14B |
|---|---|---|---|---|---|---|---|---|---|---|
| CoT Prompt (%) | 12,158 | 74.28 | 61.08 | 67.29 | 78.56 | 81.23 | 87.21 | 71.12 | 84.69 | 66.45 |
| Singleton (All) (%) | 51,007 | 66.16 | 76.33 | 75.93 | 60.92 | 61.67 | 75.06 | 69.19 | 72.93 | 58.13 |
| Singleton (True) (%) | 13,056 | 69.85 | 81.11 | 27.71 | 69.36 | 65.43 | 72.45 | 60.24 | 47.64 | 83.60 |
| Singleton (False) (%) | 37,951 | 64.89 | 74.69 | 92.52 | 58.02 | 60.38 | 75.97 | 72.27 | 81.64 | 49.36 |
Key Observations
- Premise supervision matters: Fine-tuned models (IVL2.5-FT-S / FT-CoT) consistently outperform their base counterparts under CoT prompting.
- Prompting shifts error profiles: Models exhibit markedly different behavior on True vs False premises, revealing asymmetric reasoning biases.
- Vision-centric models excel at false-premise detection: IVL2-8B achieves the highest accuracy on Singleton (False) premises.
- Scaling alone is insufficient: Larger models (e.g., IVL3-14B) do not uniformly dominate at the premise level, reinforcing the need for structured supervision.
These results complement the chain-level analysis by isolating local premise fidelity, helping disentangle surface coherence from grounded visual reasoning.
Results: Chain Reasoning Performance
Table: Performance comparison across models and prompting modes on chain-based reasoning.
ΔAccVPP and ΔDCP denote CoT gains over Singleton prompting.
| Model | Prompt | Premise Acc (%) | AccVPP (%) | DCP (%) | ΔAccVPP | ΔDCP |
|---|---|---|---|---|---|---|
| GPT-4o | CoT | 81.80 | 11.25 | 79.60 | –2.63 | +3.24 |
| Singleton | 67.81 | 13.88 | 76.36 | |||
| Gemini 2.5 | CoT | 78.34 | 24.03 | 75.72 | –8.42 | +5.70 |
| Singleton | 74.36 | 32.45 | 81.42 | |||
| InternVL2-8B | CoT | 82.52 | 17.61 | 82.14 | +17.61 | +33.28 |
| Singleton | 41.28 | 0.00 | 48.86 | |||
| InternVL2.5-8B | CoT | 88.07 | 47.28 | 85.74 | +32.72 | +7.17 |
| Singleton | 69.26 | 14.56 | 78.57 | |||
| InternVL2.5-8B-FT-S | CoT | 85.63 | 42.66 | 83.31 | +37.84 | +10.78 |
| Singleton | 65.01 | 4.82 | 72.53 | |||
| InternVL2.5-8B-FT-CoT | CoT | 93.42 | 83.41 | 88.74 | +45.20 | +16.21 |
| Singleton | 71.38 | 38.21 | 72.53 | |||
| InternVL3-8B | CoT | 84.11 | 39.01 | 81.43 | +30.00 | +5.57 |
| Singleton | 66.31 | 9.01 | 75.86 | |||
| InternVL3-9B | CoT | 92.15 | 79.15 | 87.88 | +76.56 | +23.97 |
| Singleton | 54.41 | 2.59 | 63.91 | |||
| InternVL3-14B | CoT | 80.42 | 11.68 | 81.48 | –22.95 | –0.86 |
| Singleton | 75.42 | 34.63 | 82.34 |
Key Observations
- Chain-of-Thought does not universally help: GPT-4o and Gemini 2.5 show negative ΔAccVPP, despite modest gains in DCP.
- Vision-centric models benefit most from CoT: InternVL-2/3 families exhibit large CoT gains, especially in AccVPP.
- Fine-tuning on premises amplifies chain validity: InternVL2.5-8B-FT-CoT achieves the strongest full-chain performance.
- Scaling is non-monotonic: InternVL3-14B regresses under CoT, highlighting brittle reasoning at larger scales.
These results support the central claim of orthogonal reasoning modes: models optimized for holistic fluency may sacrifice local premise fidelity, while premise-trained models excel at verifiable reasoning chains.
Results: Downstream VQA Performance
Table: NLP-QA performance on RealCQA / RealCQA-V2 across answer types, question types, and chart types.
Underlined models are zero-shot; all others are fine-tuned.
Percentages denote accuracy unless otherwise specified.
Overall Accuracy
| Evaluation | # QA | VL-T5 | CRCT | UniChart | Matcha | RealCQA | RealCQA-V2 |
|---|---|---|---|---|---|---|---|
| Total Accuracy (%) | 367,139 | 31.06 | 18.80 | 26.75 | 25.97 | 32.10 | 44.62 |
Accuracy by Answer Type
| Answer Type | # QA | VL-T5 | CRCT | UniChart | Matcha | RealCQA | RealCQA-V2 |
|---|---|---|---|---|---|---|---|
| String (%) | 19,525 | 30.68 | 3.23 | 0.88 | 2.47 | 29.50 | 83.97 |
| Numerical (%) | 115,391 | 14.87 | 31.58 | 0.83 | 4.01 | 13.39 | 15.68 |
| Ranked (nDCG@10) | 16,389 | 0.0246 | 0.0286 | 0.0113 | 0.0088 | 0.270 | 0.322 |
| Unranked (%) | 44,702 | 0.48 | 1.24 | 0.14 | 0.20 | 16.03 | 28.11 |
| Binary (%) | 171,132 | 52.75 | 18.07 | 51.53 | 52.54 | 56.19 | 67.95 |
Accuracy by Question Type
| Question Type | # QA | VL-T5 | CRCT | UniChart | Matcha | RealCQA | RealCQA-V2 |
|---|---|---|---|---|---|---|---|
| Structural (%) | 48,306 | 43.52 | 14.98 | 21.40 | 19.85 | 42.41 | 83.89 |
| Retrieval (%) | 8,220 | 58.77 | 31.31 | 24.72 | 14.20 | 50.82 | 62.44 |
| Reasoning (%) | 310,613 | 29.37 | 19.60 | 27.64 | 27.71 | 30.89 | 38.84 |
Accuracy by Chart Type
| Chart Type | # QA | VL-T5 | CRCT | UniChart | Matcha | RealCQA | RealCQA-V2 |
|---|---|---|---|---|---|---|---|
| Line Chart (%) | 115,899 | 38.24 | 19.06 | 33.51 | 32.67 | 39.78 | 50.72 |
| Vertical Bar (%) | 178,740 | 28.79 | 15.06 | 22.99 | 22.95 | 29.60 | 39.69 |
| Horizontal Bar (%) | 46,214 | 25.42 | 29.17 | 20.58 | 17.19 | 25.56 | 35.45 |
| Scatter (%) | 4,371 | 28.29 | 8.07 | 16.09 | 18.19 | 36.09 | 81.81 |
| Vertical Box (%) | 21,915 | 24.06 | 11.84 | 36.93 | 41.99 | 52.86 | 64.52 |
Key Takeaways
- RealCQA-V2 delivers a large absolute gain over prior datasets across all answer, question, and chart categories.
- Gains are especially pronounced for string answers, structural questions, and scatter / box plots, where reasoning over premises is critical.
- Zero-shot chart-specialized models (UniChart, Matcha) lag significantly behind premise-aware fine-tuning.
- Improvements in ranked answers (nDCG@10) indicate stronger ordering and relational reasoning, not just classification.
These downstream results demonstrate that Visual Premise Proving supervision transfers beyond premise evaluation, yielding substantial improvements on large-scale VQA.
Results: Dense Chart Parsing
Table: Dense chart component parsing results on UB-PMC.
Underlined models are zero-shot; all others are fine-tuned.
Each task is evaluated using its appropriate metric (listed in the final column).
| Chart Component Task | Direct Prediction | Matcha | Matcha (FT) | ChartPrem (Ours) | Evaluation Metric |
|---|---|---|---|---|---|
| Chart Type | 94.63 | 35.21 | 80.96 | 98.72 | F1 (Precision/Recall) |
| Dependent (Y) Axis Title | 75.62 | 21.85 | 47.82 | 77.80 | Text Matching |
| Y-Min Value | 73.42 | 34.61 | 70.10 | 97.59 | Absolute Value |
| Y-Max Value | 62.22 | 24.74 | 54.63 | 96.50 | Absolute Value |
| Independent (X) Axis Title | 85.62 | 42.30 | 79.34 | 92.38 | Text Matching |
| X-Min Value | 73.42 | 24.61 | 62.77 | 96.94 | Absolute Value |
| X-Max Value | 62.22 | 34.74 | 57.02 | 95.31 | Absolute Value |
| Categorical X-Tick Labels | 68.83 | 33.78 | 58.76 | 79.74 | 1:1 Accuracy |
| Is Categorical | – | 82.97 | 91.48 | 100.00 | Binary |
| Is Logarithmic | – | 84.65 | 93.24 | 100.00 | Binary |
| Is Legend Present | – | 77.32 | 90.66 | 100.00 | Binary |
| Number of Data Series | – | 38.43 | 56.57 | 82.61 | Absolute Value |
| Legend Name | 82.93 | 47.92 | 73.86 | 91.27 | 1:1 Accuracy |
Key Observations
- ChartPrem achieves near-perfect performance on structural and numeric chart components, especially axis bounds and binary attributes.
- Zero-shot chart parsers struggle with numeric grounding (min/max values, series counts), despite reasonable performance on categorical detection.
- Fine-tuning improves but does not close the gap: Matcha (FT) remains significantly below ChartPrem on value-based tasks.
- Explicit premise-level supervision enables joint recognition + localization, rather than surface pattern matching.
These results show that dense chart understanding benefits strongly from explicit visual premise modeling, providing accurate component extraction that directly supports downstream reasoning and VQA.
🙏 Acknowledgements
- Figure sources: TBD
- Inspired by: premise-grounded evaluation + chain-based reasoning ideas